GEOGRAPHIC INFORMATION SYSTEM (GIS) is a system for creation and management of spatial data with accompanying attributes. In a narrow sense, it is a computer system capable of integration, storage, editing, analysis and display of information related to spatial location. In a wider sense, GIS is a “smart map” that enables the users to create interactive queries, analyse spatial information and implement changes.
Technology of the geographic information system can be used for scientific research, resource management, property management, development planning, spatial planning, cartography and infrastructure planning. GIS is also often used for marketing research, geology and civil engineering purposes, but it can also be used in all the fields that use data related to maps.
GIS consists of four interactive components – input subsystem that converts maps and other spatial data into digital format (the so-called data digitalisation); subsystem for data storage and retrieval; subsystem for analysis and output subsystem for production of maps, tables and answering set queries.
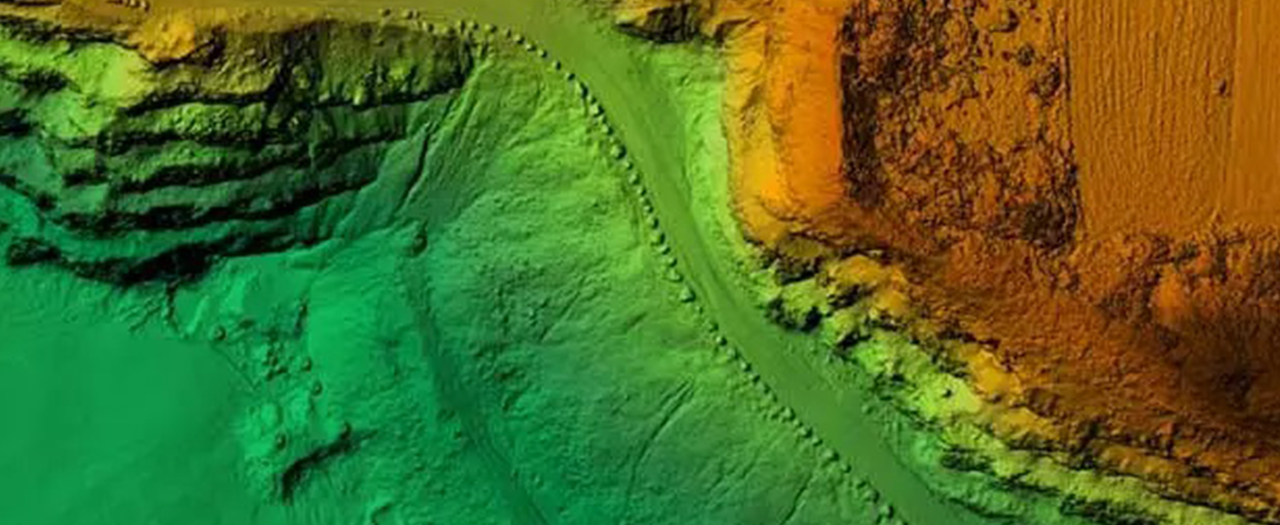
Modern GIS technologies use information in digital format, generated using various methods. The sources of spatial data are measurements in the field, takeover of plans or maps in vector file formats, digitalisation of maps and plans, processing of aerial photogrammetric or satellite images. Digitalisation has the widest application, as it transforms a hard-copy map or a plan into a digital format using CAD (computer-aided design) program, and offers possibilities of georeferencing. Great accessibility of orthorectified images (satellite and aerial images), heads-up digitising, has become the main method of geographic data extraction. Heads-up digitising implies tracing of geographic data directly on top of the aerial images instead of using by now already outdated method of tracing geographic data using a graphics tablet.
Information represent data on artificial and natural objects in a specific space. These are, for example, infrastructure structures, residential, sports and other facilities, hydroaccumulation, rivers, land purpose, terrain elevation data, geology of the terrain, etc. Information regarding the geometry of objects can be in the form of raster and vectors.
Since one pixel has one numeric value, roughly speaking, raster holds as many information as it has pixels. Raster can be displayed per channels – RGB channels, i.e. red, green and blue part of the visible light spectrum. By overlaying thus prepared raster and combining them in different ways, it is possible to obtain a larger number of information regarding a certain area.
Display of information in vector form refers to geometry of forms (length, height, shape), whether the entities in question are linear or polygonal, as well as their spatial position (location in the coordinate system). Apart from these information, there are additional information in GIS, the so-called non-spatial data, that can be connected to certain raster or vector data. For example, a forest can be spatially represented in the shape of an irregular polygon (polygonal entity), while the non-spatial data can be data regarding the types of trees, their number, presence of various species in percentages, etc.